How hot is your computer? If your employees are noticing machines slowing down or failing then overheating could be the reason why. We show you the best CPU load & temperature monitors to help you stay on top of failing hardware on your network.

All PCs and servers on your network emit heat but there is a limit to the amount of heat a computer can withstand before damage is done to hardware.
CPU temperature monitors enable you to monitor CPU temperature from one location. Monitoring the temperature allows you to identify when hardware devices are overheating and gives you a chance to fix the problem before any damage is done to the device – which is vitally important for network troubleshooting.
- Here is our list of the eleven Best CPU Load & Temperature Monitor tools
- The Best CPU Temperature Monitor Software
- Pros
- Cons
- Paessler CPU Monitoring with PRTG (FREE TRIAL)
- Site24x7
- HWMonitor
- Open Hardware Monitor
- Core Temp
- HWiNFO
- Atera
- SpeedFan
- AIDA64 Extreme
- Rainmeter
- Which CPU monitoring software works on Windows?
- Stop Your Devices from Overheating
- How do I see CPU temp on my desktop?
- Why is my CPU temperature 70 degrees on an idle laptop?
- How do I check my CPU usage?
- How do I monitor my GPU temperature?
- What CPU temperature is too high?
- What is a normal CPU temperature at full load?
- What do I do if I don’t get a CPU temperature reading?
- Can CPU temperature be wrong?
- Speed Fan
- Real Temp
- CPU Thermometer
- Speccy
- The Quick Answer – Are Your CPU Temps too High?
Here is our list of the eleven Best CPU Load & Temperature Monitor tools
- SolarWinds CPU Load Monitor Part of the Engineer’s Toolset, this monitoring tool spots when a server is being overused. Excessive use can lead to high CPU temperatures and alerts in the monitor trigger alarms when activity gets too intense. Start a 14-day free trial.
- Paessler CPU Monitoring with PRTG This all-in-one infrastructure monitor includes several sensors that accurately measure server temperature, either through SNMP or through WMI.
- Site24x7 Infrastructure This package of monitoring systems covers servers, networks, cloud services, and logs. It is a SaaS platform that will give you a constant CPU load readout for each of your servers.
- HWMonitor A hardware monitoring tool with temperature and fan speed monitoring. It is compatible with sensor chips including the ITE IT87 series and Winbond ICs.
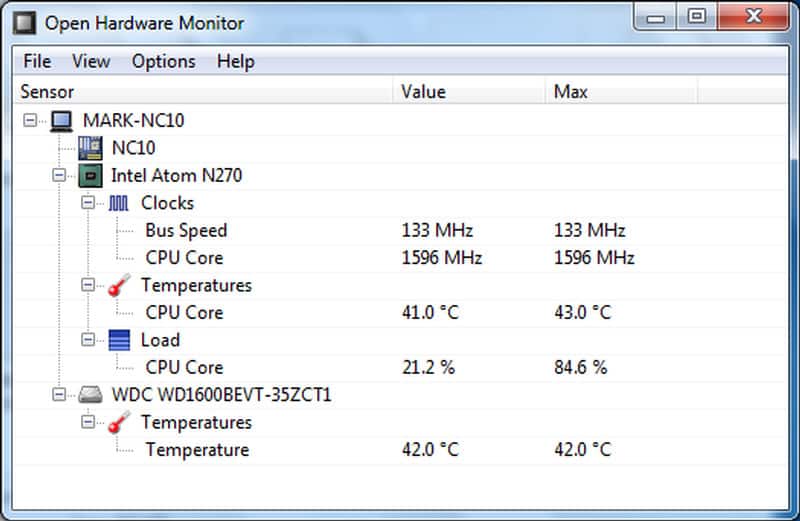
- Open Hardware Monitor An open-source hardware monitoring platform. It monitors temperature sensors, fan speeds, voltages, load, and clock speeds.
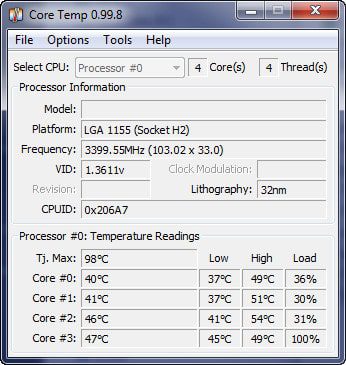
- Core Temp Temperature mentor that takes system information from the Digital Thermal Sensor (DTS) of computer processors. It has a Core Temp Monitor app for Windows and Android phones.
- HWiNFO Free hardware and temperature monitoring tool. The tool comes with real-time monitoring capabilities and a customizable alert system.
- Atera A cloud-based remote monitoring and management platform that includes device and server monitoring for a range of metrics, such as CPU metrics.
- AIDA64 Extreme Hardware monitor with support for over 250 different types of sensors that can monitor temperature, voltage, fan speed, and power. It is available for all 32-bit and 64-bit versions of Windows.
- Rainmeter Top CPU temperature monitor for Windows devices that monitors core temperatures, CPU, disk usage, and RAM. It includes customizable skins that you can use to build a unique monitoring environment.
The Best CPU Temperature Monitor Software
What should you look for in a CPU temperature monitor?
- Includes temperature read-outs per core
- Identifies motherboard temperature
- Includes thresholds on CPU temperature and a connected alert mechanism
- Can also monitor fan speed and status
- Additionally monitors processor activity
- Shows the CPU clock speed
- Allows a free period for assessment
- Offers good value for money with respect to the number of functions the software provides
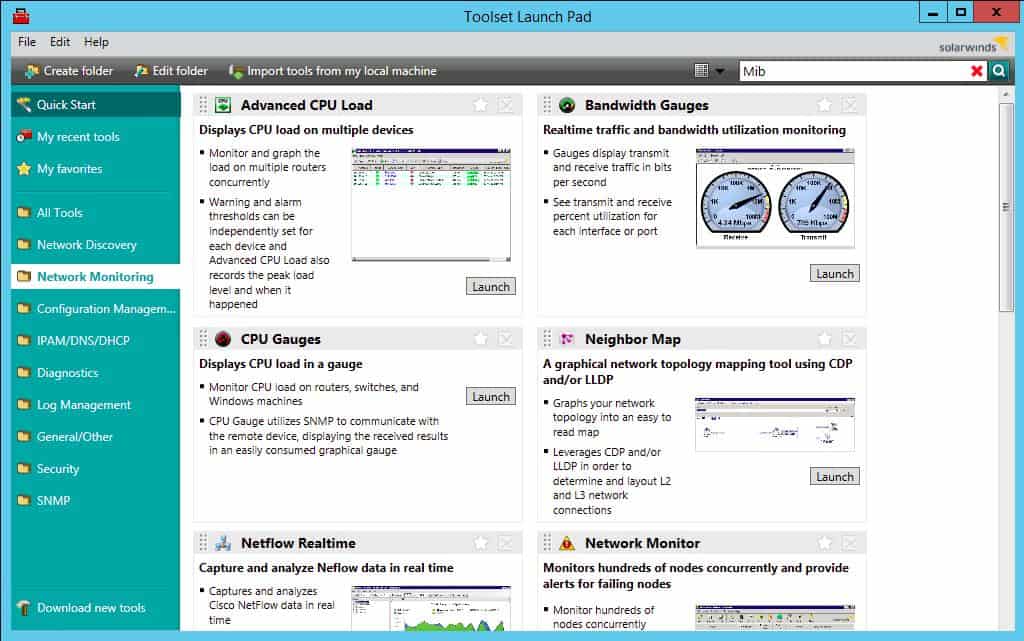
The SolarWinds CPU Load Monitor is part of the Engineer’s Toolset, which is a bundle of more than 60 monitoring and entire system management utilities. The CPU Load Monitor can track the performance of network devices and watch to make sure their hardware doesn’t get overloaded.
- Autodiscovery
- Spots capacity issues
- Live reports
- Alerts
- Notifications by email or SMS
Network devices rarely include mechanisms to measure temperature. So, there just isn’t a temperature metric to pick up from switches or routers. However, heat is usually only generated by these devices when they get overworked and the electronic elements that will create heat when overloaded are the CPU and the interfaces. The CPU Load Monitor measures these components and tracks their activity live in the Engineer’s Toolset’s dashboard.
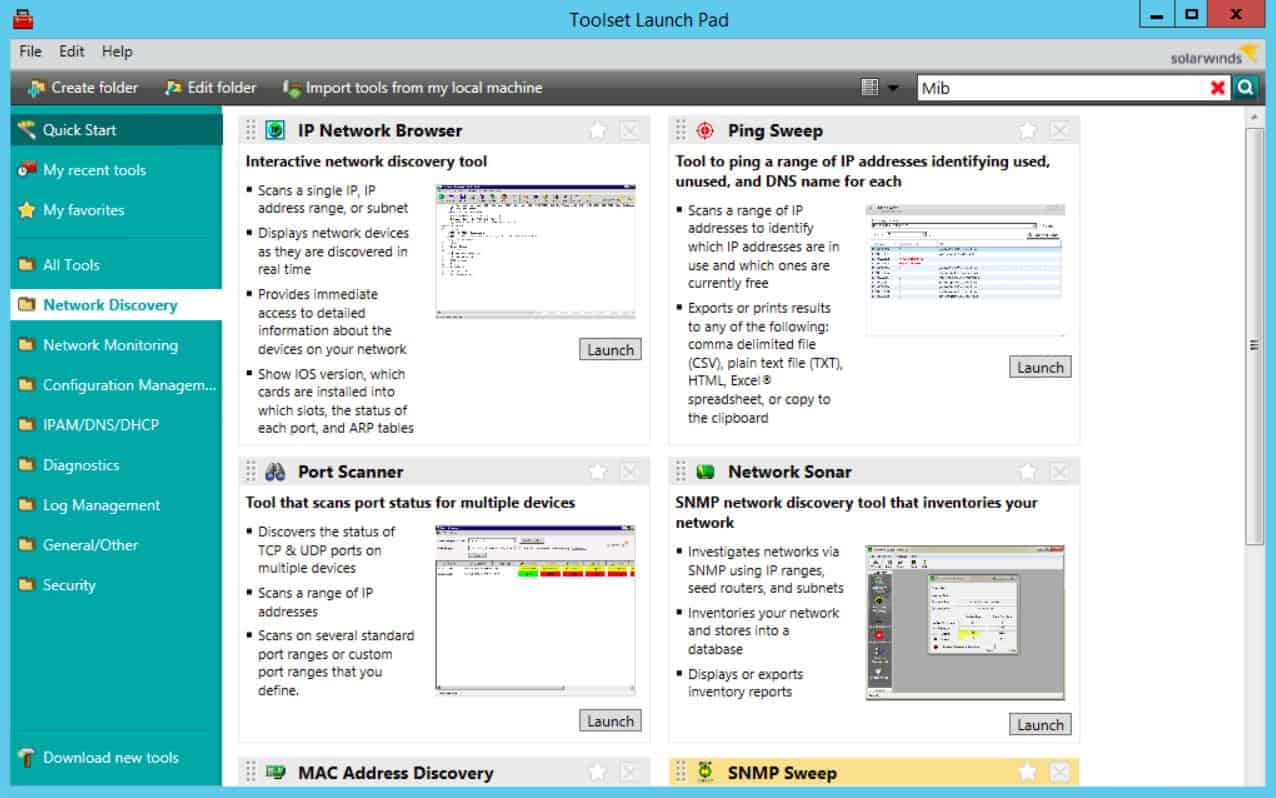
The CPU Load Monitor starts its service by searching the network for all connected devices and lists them in an inventory. Once that autodiscovery phase has been completed, each listed device will automatically be monitored and one of the tracked factors in the CPU load. The CPU load monitor also records interface statistics and memory utilization, so all of the elements inside a network device that could overheat are watched by the CPU Load Monitor.
The monitor automatically sets threshold levels on all of the performance statuses that it tracks. These can be adjusted manually. When a threshold is crossed, the CPU Load Monitor generates an alert. This alert is shown on the dashboard and is also sent out to key personnel as an email or SMS message. This facility means that technicians don’t have to sit watching the panel always for signs of overheating. The threshold levels should be set so that the warning gives staff enough time to take preventative measures before any physical damage or performance impairment occurs.
Pros
- Utilizes simple yet effective alarms for long term proactive CPU temperature monitoring
- Alerts can be set to email, SMS, or webhook to fit into virtually any alerting platform
- Uses autodiscovery to find new devices on a network automatically
- Can accurately measure the temperature of PC, server, or server host
Cons
The Engineer’s Toolset, including the CPU Load Monitor, is available from SolarWinds on a 14-day free trial.
The CPU Load Monitor is part of the Engineer’s Toolset, a one-stop-shop for all network troubleshooting needs. You can monitor multiple routers concurrently and set warnings and alarm thresholds with ease. One of the best options available today.
Download: Get 14-day Free Trial
solarwinds. com/engineers-toolset/use-cases/cpu-monitor: solarwinds. com/engineers-toolset/
Paessler CPU Monitoring with PRTG (FREE TRIAL)
Paessler PRTG is an all-in-one infrastructure monitor that covers networks, servers, and applications. When looking for a temperature monitor, there are several different systems that you could choose. The PRTG service is a bundle of sensors and every customer gets shipped the full set. When starting up the software, the systems device manager has to decide which sensors to turn on and so is able to tailor the system to adjust the necessary monitors.
- SNMP manager
- Reports on device conditions
- Uses WMI
- Live device load tracking
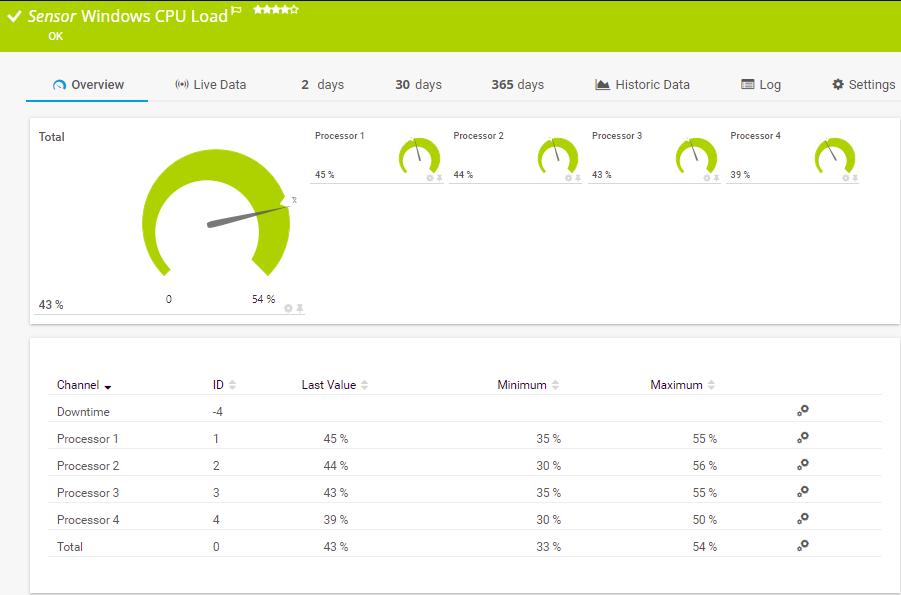
The PRTG package of sensors includes several monitors that can pick up temperature information either from servers or network devices. Temperature performance is one of the factors that can be reported through SNMP and PRTG has a sensor for that. However, not every hardware provider implements procedures to report on temperature by that method.
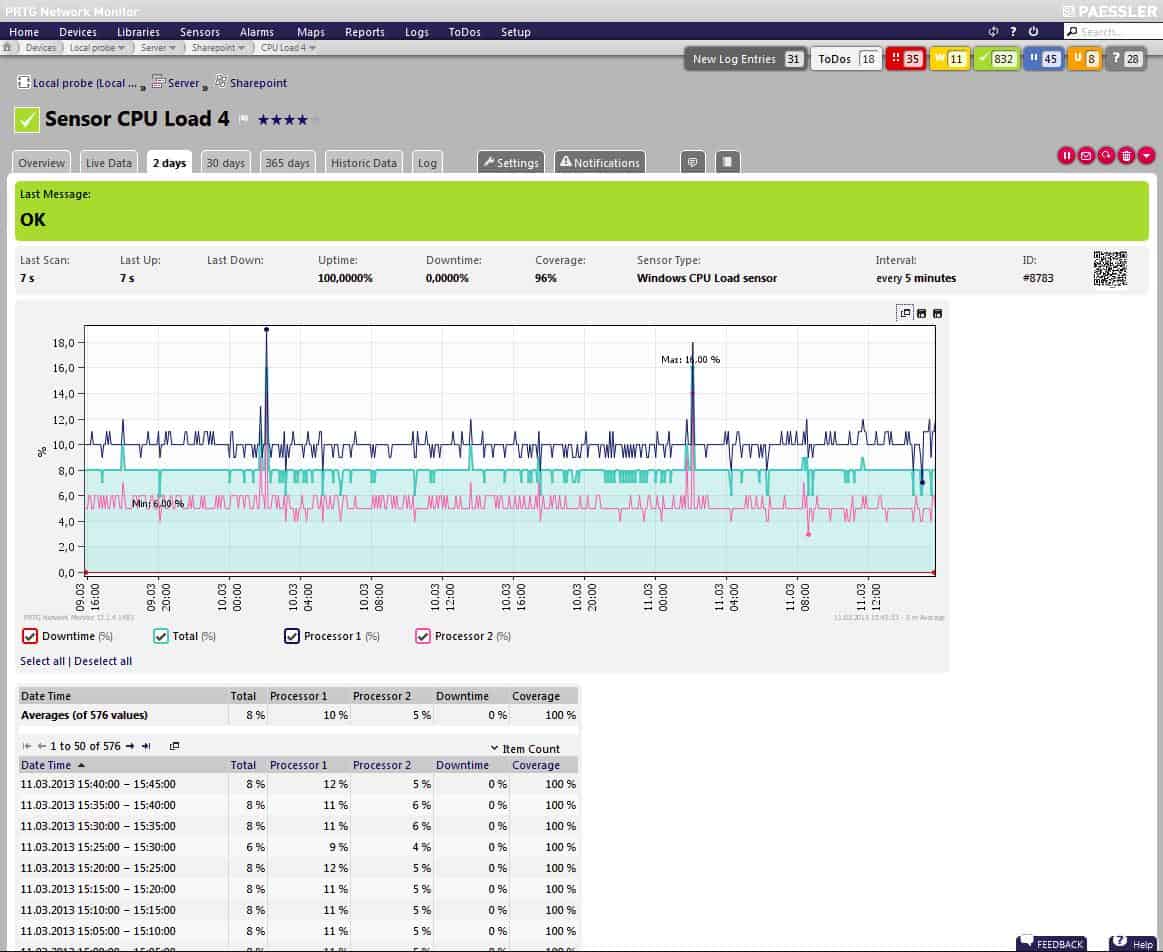
PRTG includes monitors that pick up CPU performance data on Windows servers through WMI. A sensor for Linux servers also monitors CPU performance managed by that operating system. PRTG has a total of nine different sensors that are capable of looking for temperature information gathered on servers and network devices. If none of your equipment has an actual thermometer inside, there is no way for any system monitor to collect temperature information. However, in those cases, monitoring CPU load on all devices acts as a proxy statistic for temperature statuses.
- Can be configured to measure only temperature, and then easily modified to expand that scope
- Pricing is based on the number of sensors, giving it scalability and flexibility for any size network
- Features a number of pre-configured sensors that are ready to use out-of-box
- Uses CPU load monitoring for devices without thermometers
Paessler makes PRTG available on a 30-day free trial. This is the full version of the monitoring system and you can activate all of the sensors you want during the trial period
Paessler CPU Monitoring with PRTG
Download 30-day FREE Trial
Site24x7
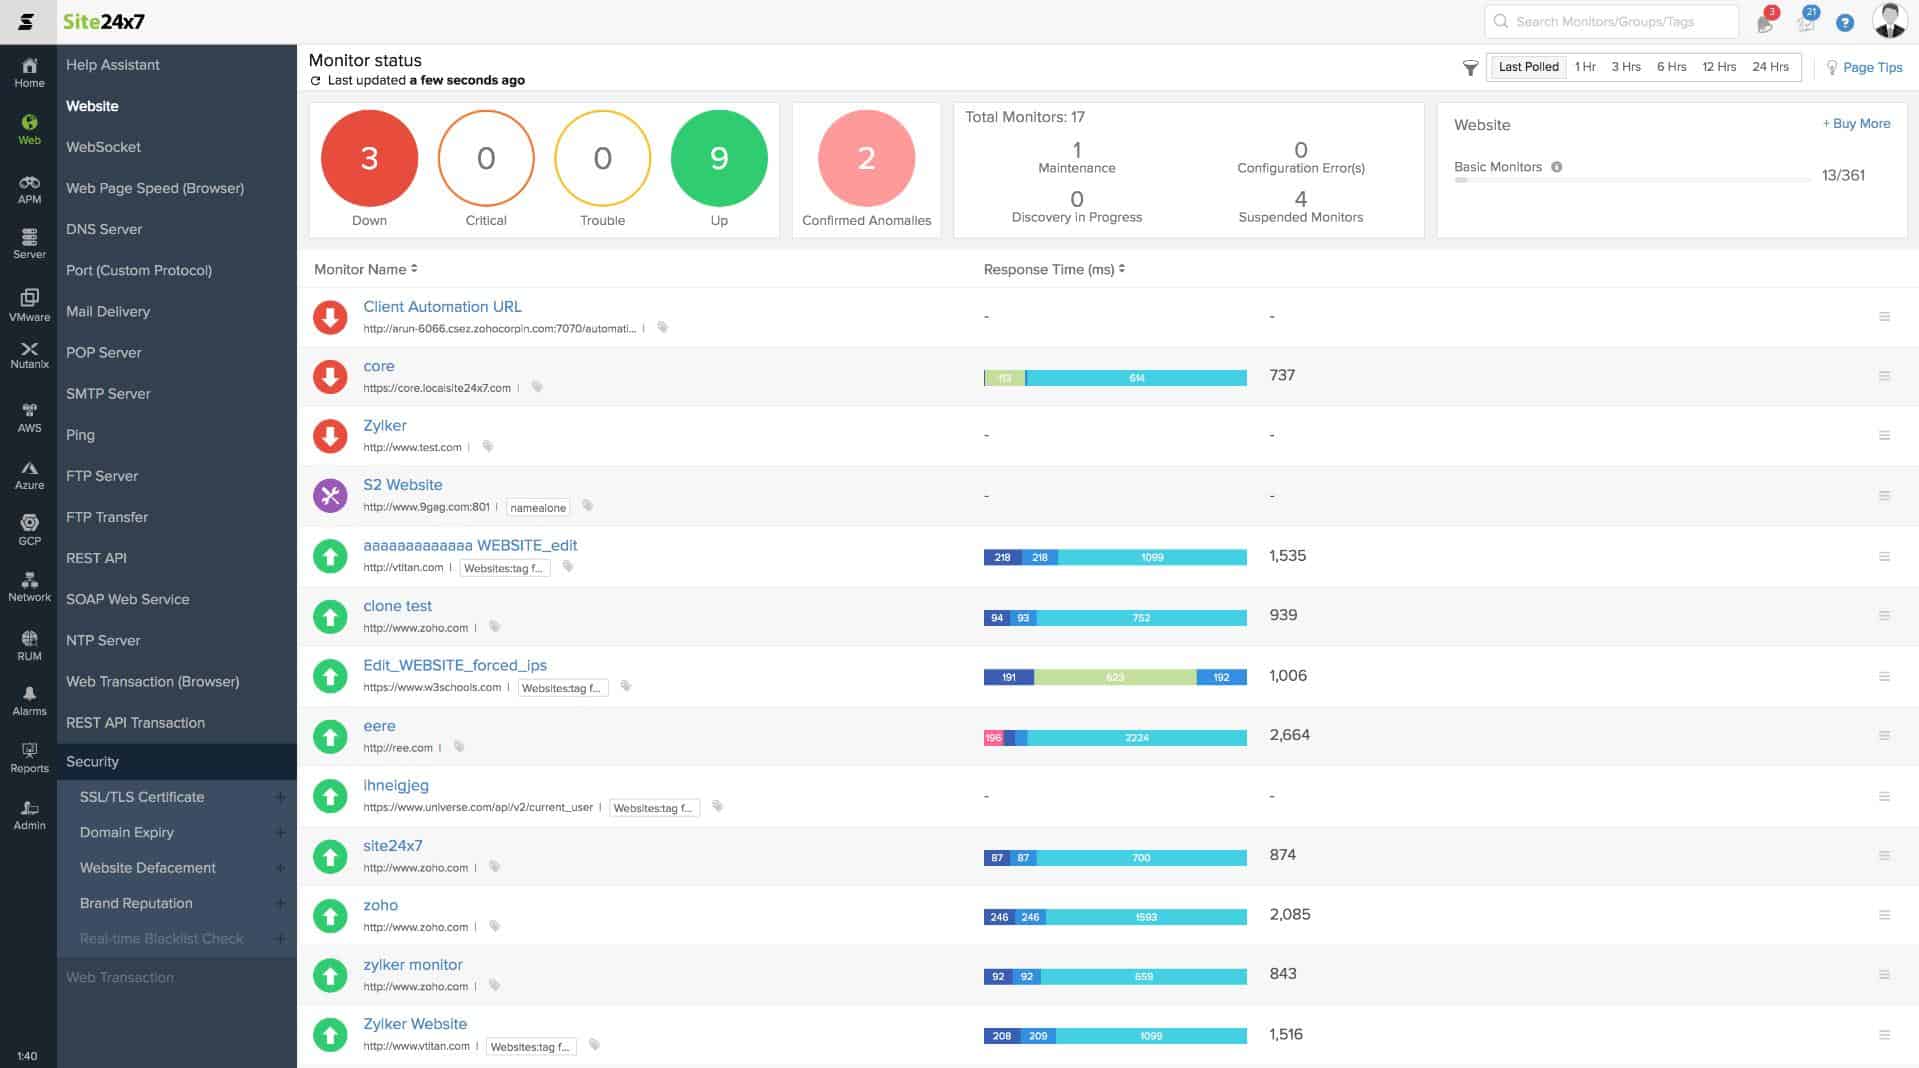
Site24x7 is a cloud platform that offers bundles of monitoring services for both on-premises and cloud resources. The Infrastructure package includes network, server, cloud resources, and log monitoring. One of the key metrics that the server monitoring section of this tool tracks is CPU utilization.
- Delivered from the cloud
- Monitors physical and virtual systems
- Centralizes supervision of multiple sites
This package is able to monitor servers running Windows, Windows Server, or Linux (SUSE, Debian, and CentOS). The service can also monitor the CPU load for Docker, Kubernetes, Hyper-V, and VMWare implementations.
A great benefit of this package is that it enables you to monitor all of your resources with one subscription.
- Bundles together a range of system monitors
- A great option for small businesses
- No need to run any software on your premises to get this monitoring service
The bundling of a range of monitoring services into one package is a great deal for small businesses because this ends up costing a lot less than buying separate monitoring systems for networks, logs, and servers. These are industry-leading tools that big businesses use. The Server monitor shows CPU utilization as standard but all dashboards can be customized. Access a 30-day free trial of Site24x7 Infrastructure.
HWMonitor
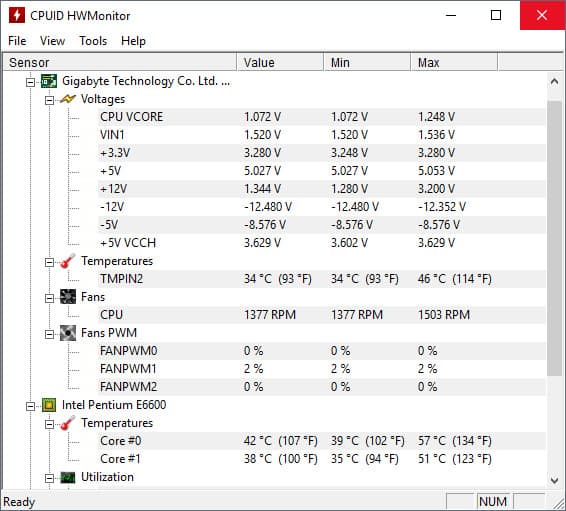
HWMonitor is a hardware monitoring tool for Windows that monitors computer temperatures, voltages, and fans. The software monitors the hard drive and video card GPU temperature. These metrics give you a strong indication of the overall health of a device.
- Temperature, fan, and voltage monitors
- Free version
- Low CPU usage
- Freeware, with paid options for remote monitoring
- A great option for home labs and smaller networks
- Available for both Linux and Windows
- Interface isn’t customizable making it difficult to track only the metrics you want
- Could use better visualization features when reporting over longer periods of time
When using the PRO version you can monitor multiple PCs in a list view. Next to each device you can view the Value, Min, and Max temperatures of hardware components. The list perspective makes it easier to monitor multiple devices at once. You can download the program for free.
Open Hardware Monitor
- Free to use
- Monitors temperature, voltage, clock speed, and fan speed
- Runs on Windows and Linux
- Is a free open-source transparent project
- Can measure other metrics like fan speed, clock speed, and voltage alongside temperature readings
- Better suited for home PCs and enthusiasts
- Only available for Windows
- No management console, cannot monitor multiple machines at the same
- Not ideal for a business environment
Core Temp
- Focused on temperature
- Reports metrics measured by the core
- Extensible
- Supports an Android and iPhone app for remote monitoring
- Is completely free for personal use
- Barebones interface makes the tool very lightweight and resource conservative
- Relies on a plugin for additional functionality for visuals, would like to see this built into the product itself
- Great for home use, but not detailed enough to support a large network
- Lack alerting features
Core Temp is available for Windows XP, Vista, 7, 8,10, 2003 Server, 2008 Server, 2012 Server, and 2016 Server. For commercial use, you have to purchase a commercial license. You can request a quote from the company directly. Download Core Temp for free.
HWiNFO
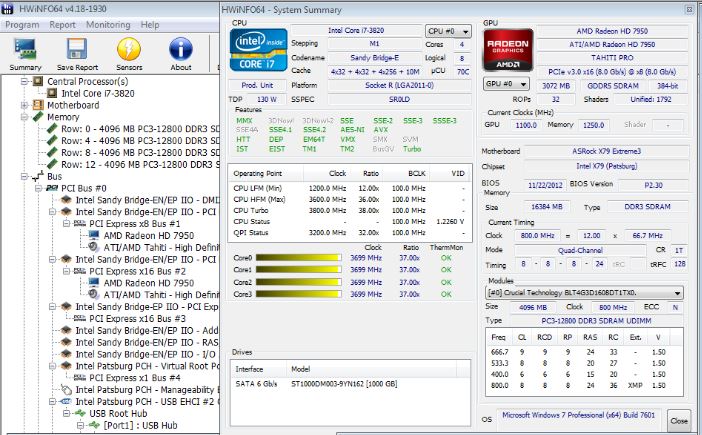
- Free to use
- Always on
- Provides a Desktop sidebar
Customizable alerts help to keep track of overheating and performance degradation. There are also add-ons you can use to augment the monitoring experience. For instance, the HWiNFOMonitor plugin adds a customizable sidebar which displays CPU performance with bars and graphs.
- Extremely detailed, includes metrics not found in other tools like cache sizes, ratio, clocks speed per core, and timing information
- Can track other metrics such as GPU and disk utilization
- Is fully customizable
- Offers built-in visualizations
- Cluttered interface makes it difficult to track metrics on devices with many parts like servers or hosts
- Only available for Windows
- Lack proactive features like robust alerting options and inventory management
HWiNFO is ideal for enterprises that require a free CPU monitoring solution. The tool is available HWiNFO32 for Windows 32-bit and HWiNFO64 for Windows 64-bit. You can download the program for free.
Atera
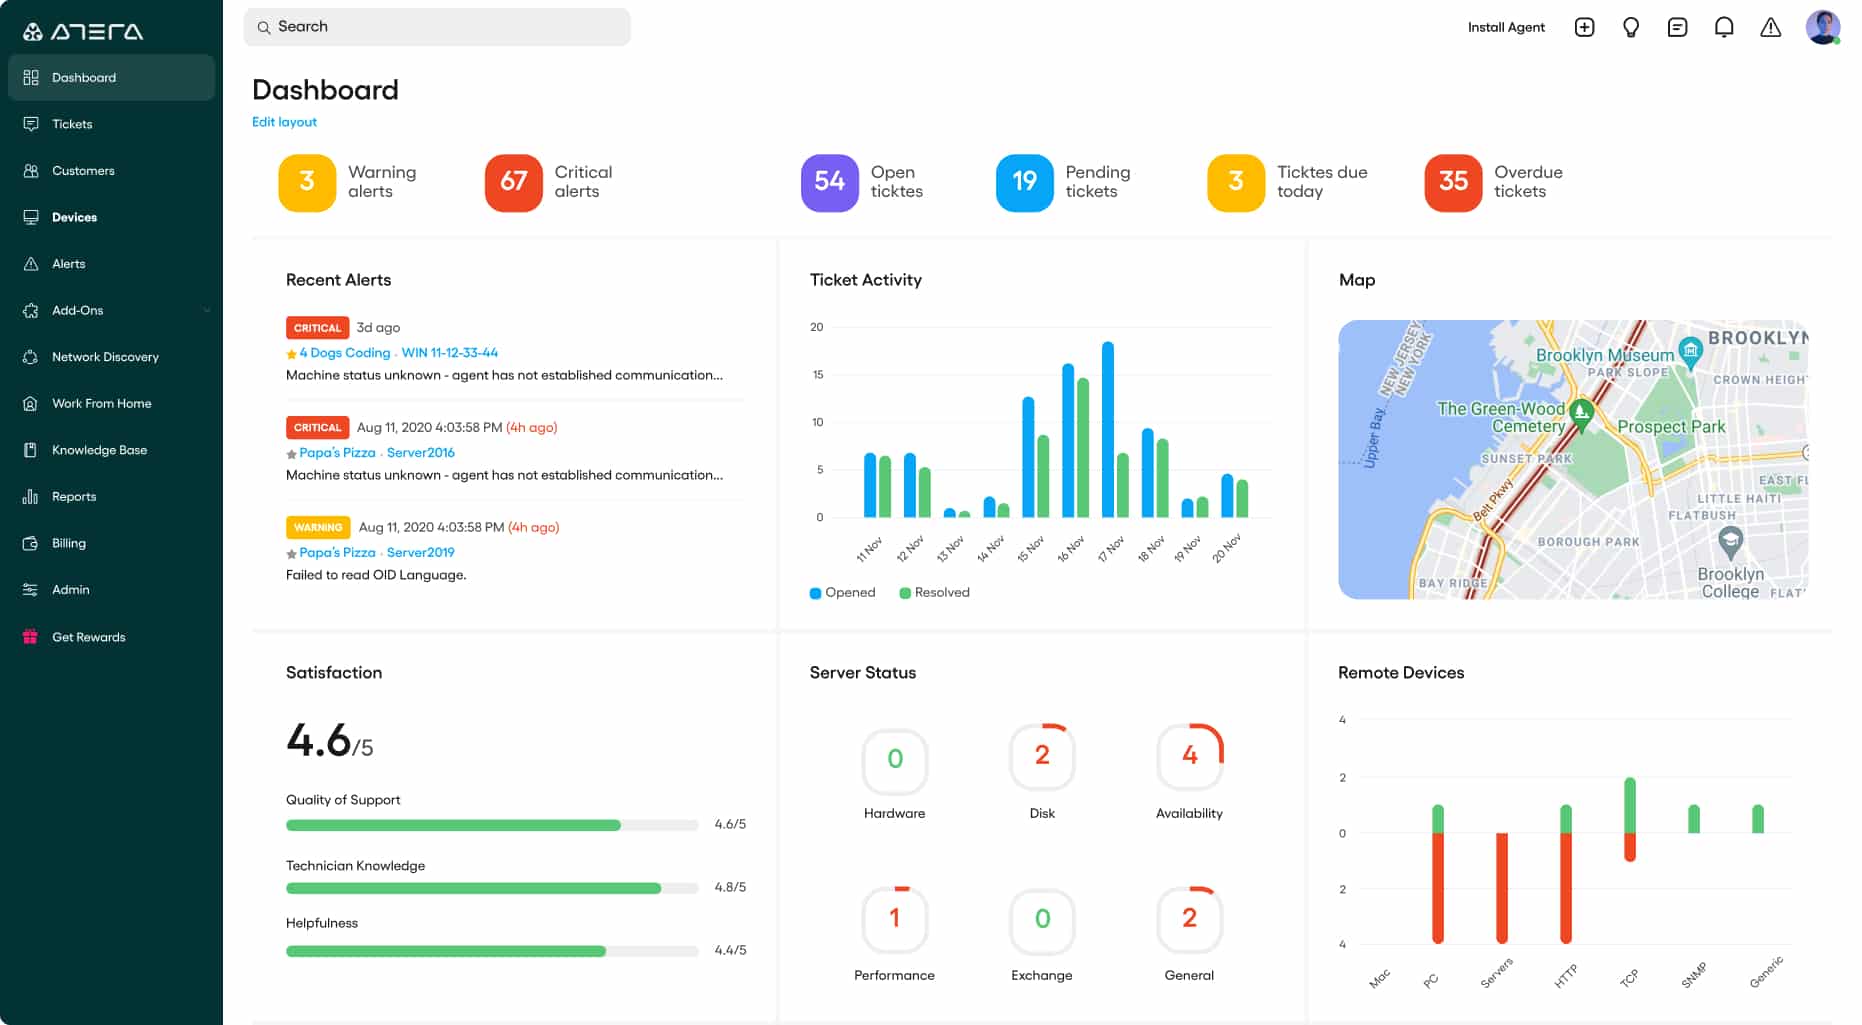
Atera is a cloud-based platform that includes all of the software that a managed service provider (MSP) needs to run its business. The remote monitoring and management (RMM) module of the system includes monitoring screens for networks, servers, endpoints, and applications.
- Designed for MSPs
- Monitors multiple sites
- Tracks device capacity utilization
The device, endpoint, or server monitoring screens include a range of statuses, including CPU performance data. These categories of feedback are all live and they include CPU temperature, utilization, and capacity. Other factors shown in the screen include fan performance, memory usage, disk activity, and I/O throughput rates.
- Lightweight cloud-based monitoring application
- MSP/reseller focused, making this a great option to provide temperature readouts as a part of your service offering
- Offers some of the best visual dashboards and reporting capabilities compared to its competitors
- Can also list disk I/O, memory usage, fan speeds, disk capacity, ect, making this a more holistic tool for device health monitoring
- Product is a subscription service, making it affordable for any size network
Atera is a subscription service with a rate per technician per month. The cloud-based dashboard is accessed through any standard browser, so you don’t need to host the Atera software on-premises. You can get a free trial to experience the platform for yourself.
SpeedFan
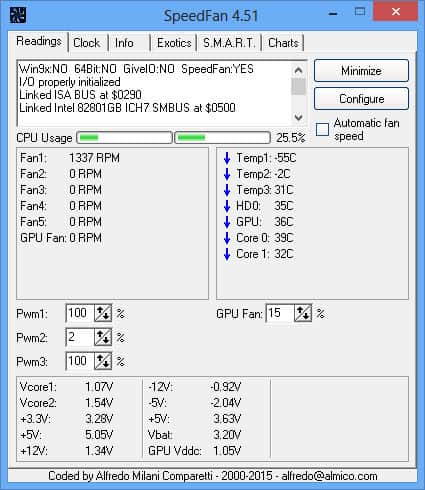
SpeedFan is a hardware monitor that monitors: temperature, fan speed, voltage, and hard disk temperatures. The software can also display S. T data from hard disks. With SpeedFan you can configure the program to change fan speeds remotely according to the system temperatures. For example, you can choose a minimum and maximum fan speed.
- Temperatures, voltage, and fan speed
- CPU and disk monitoring
- Free to use
Similarly, if you want to view visual displays then you can do so through the Charts window. The Charts window displays performance charts that allow you to choose what metrics you want to monitor. Simply enter the start and end time of your reading, what elements you want to monitor, and the values you want to see.
- Simple installation that begins pulling metrics immediately
- Built for individual machine monitoring with a simple interface
- Not for larger networks
- Lacks long term monitoring features
- Reporting features could use improvement
SpeedFan is available for Windows 9x, ME, NT, 2000, 2003, XP, Vista, Windows 7, 2008, Windows 8, Windows 10, and 2012. You can download the tool for free.
AIDA64 Extreme
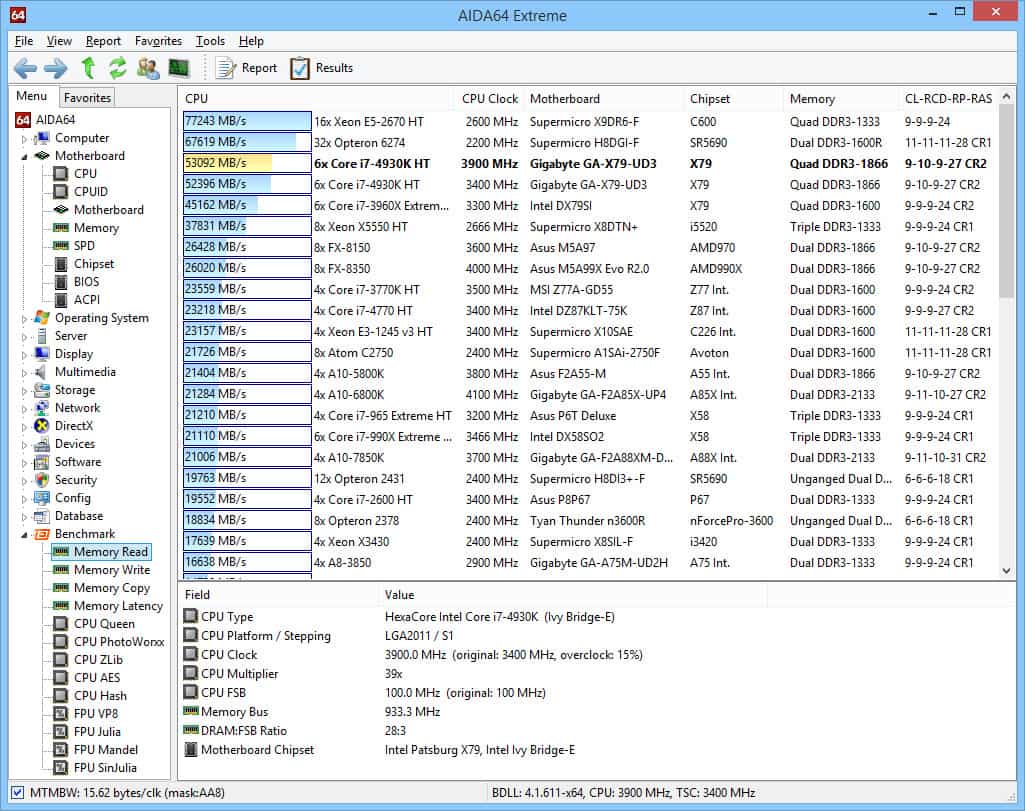
- Customizable dashboard
- Extensive device monitoring capabilities
- Version available for 32-bit systems
- Monitors temperature as well as virtually all aspects of a devices performance and hardware specifications
- Designed for technicians, outputs very detailed measurements and incredibly detailed with over 250 sensors
- Supports external displays, ideal for network operation centers, or smartphone apps
- Only available for Windows
- Licensing is marketed towards smaller networks, not enterprise companies
- Interface can feel overwhelming without customization
- Would like to see better alerting features with more options
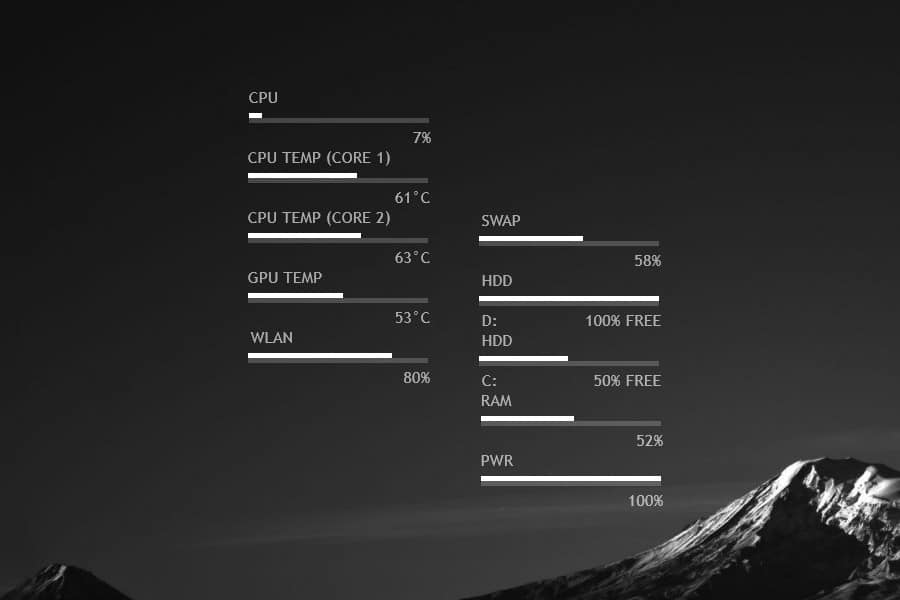
Rainmeter
- Attractive interface
- Free to use
- Reports on resource utilization and temperature
Skins are drag-and-drop so you can create a custom monitoring panel for better visibility. You can also use one of the starter skins so you don’t have to create any if you don’t want to.
- Sleek minimalist design is both lightweight and nice to look at
- Completely free, open-source, and transparent
- Track temperature, CPU, RAM, and disk metrics
- Can apply custom skins via plugin or pre-made start pack
- Uses drag and drop menus to customize your dashboard
- Lacks a robust reporting feature for long term monitoring
- Lacks device management capabilities for bigger networks
Which CPU monitoring software works on Windows?
NamePlatformPrice
SolarWinds CPU Load MonitorWindowsFree trial
HWMonitorWindowsFree version available
Open Hardware MonitorWindows, LinuxFree
Core TempWindowsFree
Paessler CPU Monitoring with PRTGWindows, Linux, MacFree trial
HWiNFOWindowsFree
SpeedFanWindowsFree
AIDA64 ExtremeWindowsFree trial
RainmeterWindowsFree
Stop Your Devices from Overheating
CPU temperature monitors make it easier to monitor the heat of an entire network of devices. SolarWinds CPU Load Monitor (with ETS), Atera, PRTG, HWMonitor, and Open Hardware Monitor are all reliable solutions for monitoring CPU performance. Implementing regular hardware monitoring with CPU monitors will make sure your devices stay available year-round.
How do I see CPU temp on my desktop?
There isn’t a CPU temperature monitor in your operating system. In order to get information about CPU temperature, you would have to go down to the BIOS. It is much easier to install a monitoring tool. We recommend the SolarWinds CPU Load Monitor to check on heat-generating activities or the HWMonitor, which interprets BIOS data in a GUI interface.
Why is my CPU temperature 70 degrees on an idle laptop?
A CPU temperature of 70 degrees Celsius is normal when the computer is very active. However, when idle, the CPU’s temperature should be around 45 degrees. A high temperature implies that the CPU is not really idle, but has a heavy workload put on it by background tasks and services. If the CPU monitor shows that this is not the case, then the high temperature could be a sign of a broken fan.
How do I check my CPU usage?
In Windows, CPU usage is displayed as a live metric in the Task Manager.
- Right-click on the Task Bar at the bottom of the screen and select Task Manager from the pop-up menu.
- Wait for the Task Manager to open and then click con the Performance tab.
- Click on CPU at the top of the left-hand options list to see a live graph of CPU performance.
How do I monitor my GPU temperature?
- Right-click on the taskbar and click on Task Manager in the popup menu.
- When the Task Manager opens, click on the Performance tab.
- Scroll down the left-hand menu to find GPU. The mini display there includes the GPU temperature in Celsius.
What CPU temperature is too high?
There are many factors to be taken into account when working out what is an acceptable CPU temperature. However, as a rule of thumb, for an Intel processor, a temperature of more than 40 degrees Celsius when it is inactive is worrying and a temperature of more than 85 degrees Celsius when it is under full load is a cause for concern.
What is a normal CPU temperature at full load?
For Intel processors, generally, the normal CPU temperature at full load is between 50 and 60 degrees Celsius. Intel Celeron processors run hotter at about 65 to 80 degrees Celsius under full load. AMD processors don’t have as much variability per model as Intel processors. They shouldn’t go above 70 degrees Celsius under full load.
What do I do if I don’t get a CPU temperature reading?
If you are using a temperature monitor and it doesn’t give you a reading, the chances are that the program you chose is not compatible with the status output mechanism of your CPU temperature gauge. Picking a different temperature monitoring package might solve the problem.
Can CPU temperature be wrong?
There are a number of factors in the chain of activity that goes into temperature reporting and if one of them is faulty, you will get an incorrect report, so CPU temperature monitoring can go wrong. To work out whether the temperature monitor is giving incorrect reports, look for illogical results. For example, if your CPU registers no activity and the fan is working properly but the monitor says that the temperature is high, the monitor is probably wrong.
Related post: CPU Monitoring Guide & Tools
Need some help monitoring your CPU’s temperature? In this guide, we’ve listed some of the best CPU temperature monitors (all free) to help you pick the tool that is best for your needs.
Whether you’re having problems with your computer and you’re looking for some hardware monitoring tools to help you diagnose the problem, or you want to stress test your newly-built PC to make sure everything is running properly, a program that can monitor your CPU’s operating temperatures is an important tool to have.
In this post, we’ve listed nine of the best CPU temp monitors currently available so that you can ensure that your CPU is operating at safe temperatures.
Table of Contents
As long as you don’t need an extensive hardware monitoring program and you just want a lightweight and straightforward CPU temp monitor, then Core Temp is probably the best option for you. Core Temp provides you with real-time CPU temperature and load monitoring. If you have an Intel processor, Core Temp will show you the individual temperature and load for each of your CPU’s cores.
The program also gives you information like current operating frequency, power draw, and core voltage and it will tell you what processor you have in your system, what socket it uses, and what lithography the CPU is.
Get Core Temp Here
HWMonitor is a great tool if you’d like to monitor more than just your CPU. HWMonitor displays not only your CPU’s temperature, core voltage, operating frequency, and load, but it is also able to monitor your GPU, your fan speeds, your storage devices, and plenty more. So, if you need a CPU temp monitor that can do more than just monitor CPU temperatures, HWMonitor is worth a look.
Get HWMonitor Here
Speed Fan
Speed Fan is another CPU temperature monitoring program that you’ll want to consider. Like some of the other options on this list, Speed Fan can present you with real-time information on your CPU and other hardware. However, Speed Fan is also unique in that it will allow you to change your fan’s speed directly in the software.
Another great feature of Speed Fan is how many different customization options it has. The tool can range from being a simple hardware monitoring tool that allows you to manually change fan speeds, to an extreme customization tool that will let you set your own fan settings.
Get Speed Fan Here
If you’re looking for a lightweight program that will not only monitor your system’s CPU, but also most of the other hardware in your computer, then Open Hardware Monitor might be the right option for you. Not only does Open Hardware Monitor provide temperature, voltage, and frequency readings for your CPU, it also gives you the ability to monitor your memory, your fans, and your GPU temperature as well.
So, if you’re looking for a bit more robust of a monitoring program, then Open Hardware Monitor is probably the right option for you.
Get Open Hardware Monitor Here
Real Temp
Get Real Temp Here
While we said that all of the options on this list were free, we lied. AIDA64 Extreme is not free. However, it is worth mentioning because of how versatile the tool is. And, we felt like since all of the other tools we mentioned are free, you’d give us a pass on mentioning this one.
AIDA64 Extreme has a ton of functionality, including hardware monitoring, benchmarking tools, stress testing capabilities, diagnostics, and more. It’s really a Swiss Army Knife for serious system builders. That being said, if all you need is a simple CPU temp monitoring program, AIDA64 Extreme is not only overkill, but, with plenty of free options out there, it will cost you money that you don’t need to spend
Get AIDA64 Extreme Here
CPU Thermometer
Get CPU Thermometer Here
Speccy
Get Speccy Here
Get HWiNFO Here
There are a ton of different CPU temperature monitor tools out there that can help you keep track of how your system is running. Whether you need a simple and straightforward program that will give you your CPU’s temperature and load, or you need a robust hardware monitoring program that will allow you to keep track of all of the components in your system, there is a tool out there for you. In this guide, we’ve provided a list of some of the best CPU temp monitors for you to try and one of the options above should get the job done for you.
In this guide, we’ve detailed how you can check your CPU temperatures and determine whether or not your processor is operating in a safe range.
But monitoring your processor’s temperature won’t do you any good if you don’t know what temperature it should be running at. In this guide, we’ll show you how to check your processor’s noprmal temperature range. We’ll also help you figure out how hot your CPU should be running.
Because, ultimately, every processor is built to run at slightly different temperature ranges. And, there is really not a one-size-fits-all approach to determing normal CPU temperature ranges.
(If you are looking for a quick answer, we have attempted to give you a one-size-fits-all answer below. But, just know that it will never be a great way to determine whether or not your CPU temps are too high or not
In any case, though, after reading through this guide, you’ll have a solid understanding of safe CPU temps. You’ll also learn how to determine whether or not your processor is running at the appropriate temperature.
The Quick Answer – Are Your CPU Temps too High?
Again, there is no way to give you an accurate one-size-fits-all answer to whether or not your CPU temperatures are too high or not. “Normal” CPU temps are going to vary quite a bit depending on the processor. I suggest that you read this guide in full to gain a better understanding on how you should proparly check and see what temperature your CPU (or, rather, your CPU’s cores) should be running at.
But, as a generalization that might help you identify a serious problem, if you have an Intel or AMD processor, you could say that a CPU core temperature of over 45-degrees Celsius while idling and/or a temperature of over 95-degrees Celsius while under full load is probably a cause for concern.
So, in other words, if your CPU is hitting those temperatures on a regular basis, you will likely want to dive into the problem further and see what is going on.
Again, this is a generalization. It’s probably not the best way to figure out if your temperatures are appropriate or not. For a better way to check and understand whether or not your processor’s temperatures are acceptable or not, keep reading this guide.